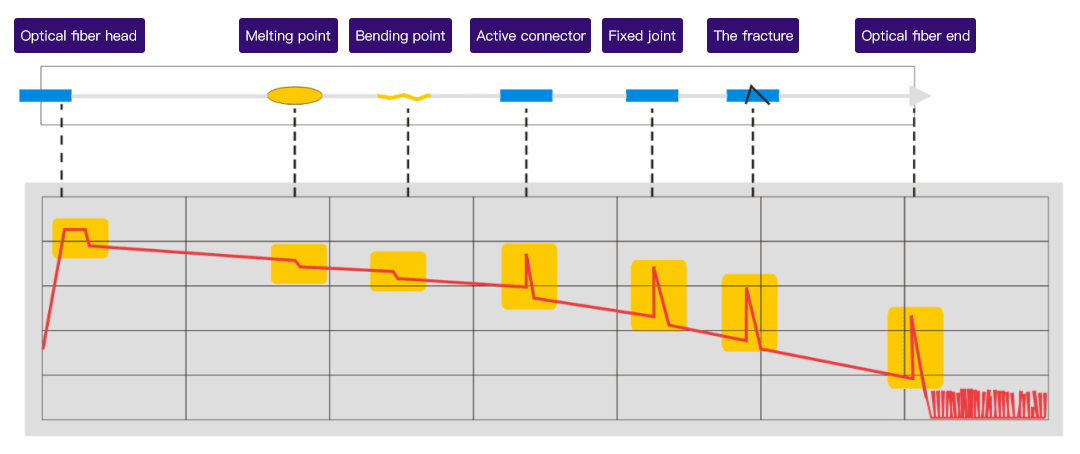
First of all, what is a curve? just look at the picture!
The red box in the figure above is a common curve chart in daily life.
How is the graph formed?
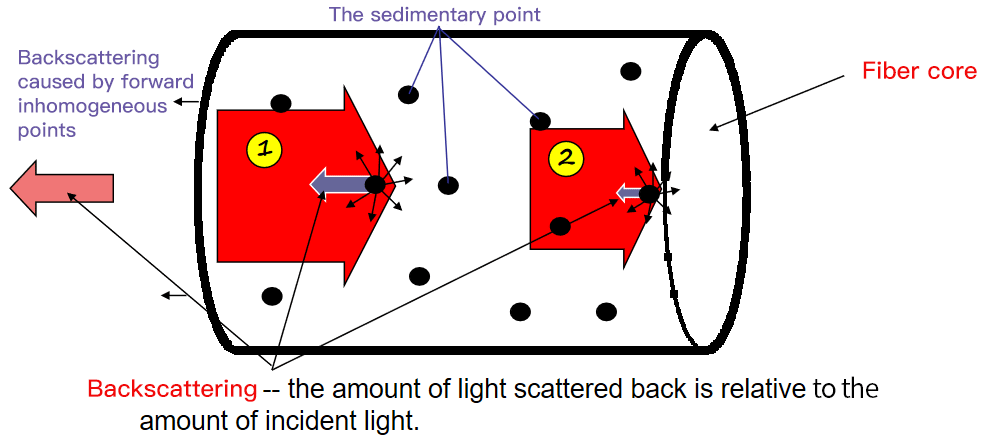
After the OTDR emits the test light, the circuit diagram is constructed through the principle of back-to-back Rayleigh scattering and Fresnel reflection.
Backscatter
The uneven deposits and impurities distributed along the fiber core scatter the test light back to the OTDR through the principle of scattering.
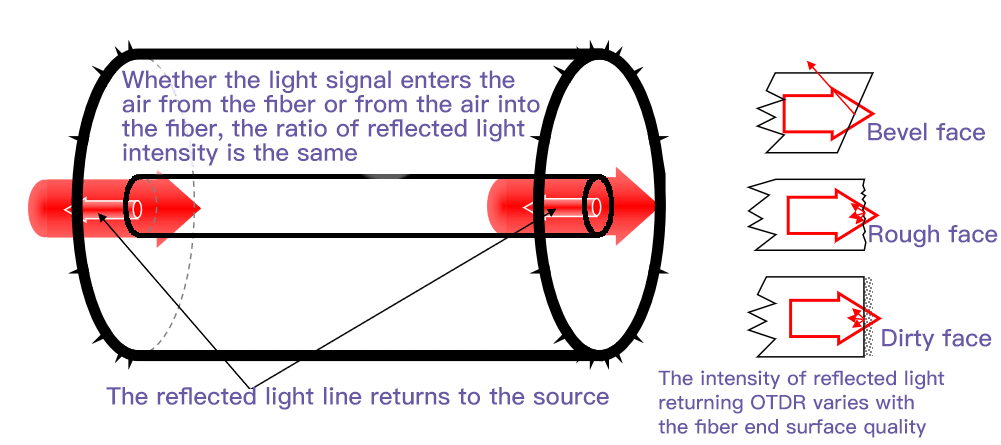
Fresnel reflection
It only occurs when the optical signal passes through the end face of the fiber, and a part of the light is reflected back at the same angle when it was incident. The reflected light intensity can reach 4% of the incident light intensity.
After the OTDR emits the test light, it continuously collects various points through the principle of backscattering and reflection, and then connects these points together, which becomes the graph we see in the OTDR.
The figure above is the process of curve formation.
Of course, a true curve rarely has a straight line going down. During this process, there will be many incidents, such as splice points, fiber bending, fiber jumpers/connectors, etc.